TL;DR
Facility leaders should track seven core maintenance metrics: response time, completion time, backlog, preventive maintenance compliance, asset downtime, vendor performance, and cost per location. The best KPI program ties each number to a clear formula, a trend review, and a next action, not a dashboard no one uses.
A maintenance dashboard only helps when each number leads to a decision. Facility maintenance KPIs turn work orders, asset history, vendor activity, and costs into signals that show where uptime is improving and where service is slipping. Facility maintenance KPI: a measurable indicator used to evaluate how well a facility team keeps buildings, assets, and service workflows functional, safe, and cost controlled. For teams that need one place to track work, vendors, and locations, Leansite gives operators a practical way to connect daily tasks with performance reporting.
Table of Contents
What are facility maintenance KPIs?
Facility maintenance KPIs are measurable indicators that show whether maintenance work is fast, reliable, cost controlled, and aligned with asset uptime goals. A KPI is a performance measurement used to evaluate progress toward defined objectives, according to the Wikipedia definition of a performance indicator. Facility management covers the coordinated management of buildings, workplaces, sites, and support services, as summarized by facility management.
Good KPIs are not vanity numbers. They connect field activity to decisions about staffing, vendors, preventive maintenance, budgets, and capital planning.
A useful maintenance KPI should answer three questions: what happened, why it matters, and what action should happen next.
Core KPI definitions and formulas
The strongest KPI set covers speed, workload, reliability, vendor execution, and cost. These seven metrics give facility leaders enough visibility without turning reporting into a full-time job.
|
KPI |
What it means |
Basic formula |
Action when trend is wrong |
|---|---|---|---|
|
Response time |
Speed from request to first action |
First action time - request time |
Rebalance dispatch rules or triage categories |
|
Completion time |
Speed from request to closeout |
Close time - request time |
Check parts delays, staffing, and approvals |
|
Backlog |
Open work not yet completed |
Open work orders by age or labor hours |
Prioritize safety, uptime, and compliance items |
|
PM compliance |
Preventive work completed on schedule |
Completed PMs ÷ scheduled PMs x 100 |
Adjust schedules, routes, or asset assignments |
|
Asset downtime |
Time an asset is unavailable |
Downtime hours ÷ operating hours x 100 |
Investigate failure patterns and PM quality |
|
Vendor performance |
Outside provider reliability |
On-time jobs ÷ assigned jobs x 100 |
Review SLAs, scope, pricing, and documentation |
|
Cost per location |
Maintenance spend by site |
Total maintenance cost ÷ location count |
Compare outliers by asset age, usage, and vendor mix |
Which maintenance metrics matter most in 2026?
The most useful 2026 maintenance metrics are the ones that separate controllable workflow delays from asset reliability problems. Response time and completion time show service speed. PM compliance and downtime show reliability. Backlog, vendor performance, and cost per location show operating control.
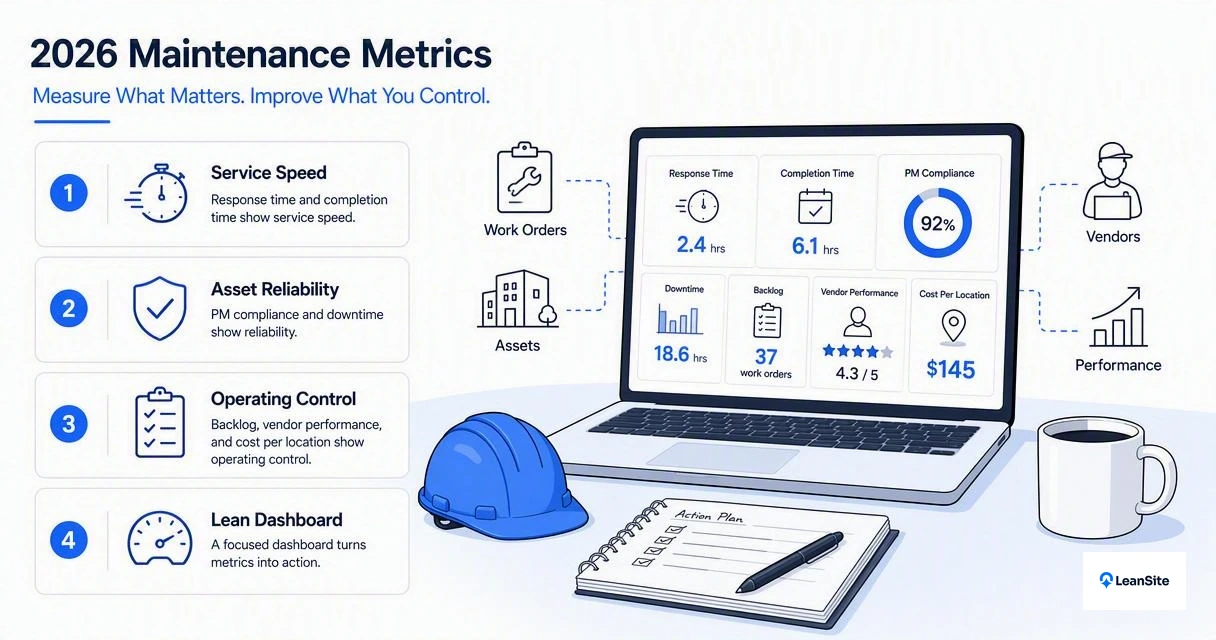
A lean dashboard should start with these groups:
-
Speed metrics: response time, completion time, reopen rate.
-
Workload metrics: backlog count, backlog age, labor hours waiting.
-
Reliability metrics: PM compliance, downtime, repeat failures.
-
Vendor metrics: on-time arrival, first-time fix, invoice accuracy.
-
Portfolio metrics: cost per location, cost per asset class, emergency work share.
Response time matters most for urgent occupant, safety, refrigeration, HVAC, and access issues. Completion time matters more for work that depends on parts, approvals, or vendors. Teams trying to tighten the front end of the workflow can use faster work order routing and closeout practices before adding more staff.
Backlog deserves special attention because it hides risk in plain sight. A rising backlog is not always bad if low-priority cosmetic work is being parked behind compliance and uptime tasks. It becomes a problem when aging work includes leaks, electrical issues, life-safety items, or assets tied to revenue. The cost side of that risk is covered in more depth in the hidden cost of deferred maintenance.
How KPI ownership should be split
Clear ownership keeps metrics from becoming finger-pointing tools. Each KPI needs a primary owner and a review rhythm.
-
Facility manager: backlog, completion time, and service prioritization.
-
Maintenance lead: PM compliance, repeat failures, and labor planning.
-
Vendor manager: arrival time, SLA compliance, documentation, and invoice quality.
-
Operations executive: cost per location, downtime exposure, and capital tradeoffs.
-
Finance partner: budget variance, emergency spend, and vendor rate trends.
How should teams calculate and review maintenance KPIs?
Teams should calculate maintenance KPIs from work order timestamps, asset records, vendor updates, and cost data, then review trends weekly for operations and monthly for budget decisions. The goal is not perfect math. The goal is consistent math that exposes delays, repeat failures, and cost outliers.
Start with clean event timestamps: request created, assigned, accepted, first action, completed, verified, and invoiced. A multi-site team also needs location, asset, priority, trade, vendor, and cost fields. Without those fields, a dashboard can show activity but not explain performance.
The Leansite platform helps teams standardize those records across locations, which matters when one district calls a job "HVAC repair" and another calls it "comfort complaint." Consistent labels make reporting far easier to trust.
Maintenance KPIs should be reviewed as trends, not snapshots. One bad week may be noise; three bad months usually needs a process change.
A simple KPI review cadence
A practical review rhythm keeps reporting light but useful.
-
Daily: check urgent open work, overdue vendor jobs, and critical asset downtime.
-
Weekly: review response time, completion time, backlog age, and PM misses.
-
Monthly: compare location cost, vendor performance, downtime patterns, and repeat failures.
-
Quarterly: decide whether to change PM schedules, vendor coverage, spare parts, or capital plans.
Spreadsheet dashboards can work for small teams, but they become fragile when email, paper, and disconnected systems spread across locations. That problem is common in multi-site operations, as covered in why teams still rely on email and spreadsheets.
Video example: building a maintenance dashboard
For teams that still model metrics in Excel, this walkthrough shows a basic dashboard approach before a dedicated work order system is added.
What should leaders do when KPIs trend the wrong way?
Leaders should treat bad KPI trends as diagnosis prompts, not scorecards for blame. Each metric points to a different root cause, so the response should match the signal.
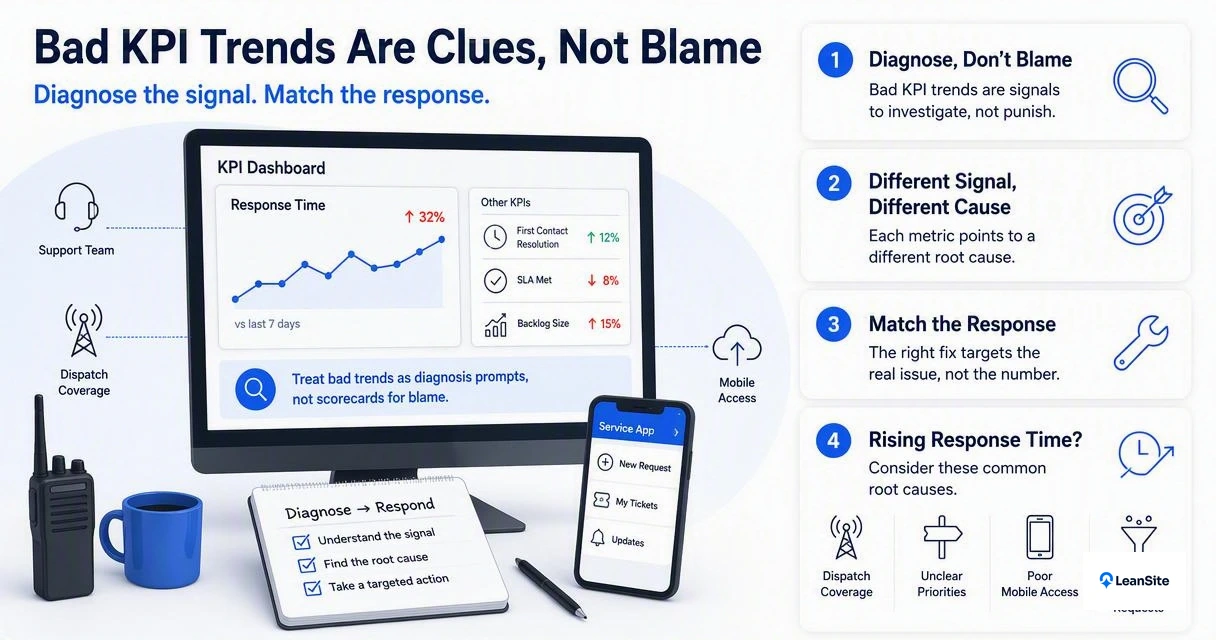
If response time rises, the issue may be dispatch coverage, unclear priorities, poor mobile access, or too many low-value requests entering the queue. If completion time rises while response time stays stable, the bottleneck is usually parts, approvals, vendor scheduling, or closeout documentation.
Downtime needs a different lens. A single high-cost failure may point to asset age, but repeated failures after PM visits point to task quality, inspection steps, or asset history gaps. Teams focused on uptime can go deeper with predictive maintenance benefits for facilities.
Vendor performance should be measured with context. A vendor may miss arrival targets because the scope is vague, access instructions are missing, or approvals take too long. Clean scopes, photos, asset tags, and closeout rules make vendor KPIs fairer and more useful.
Common trend signals and practical fixes
|
Trend signal |
Likely meaning |
First fix to test |
|---|---|---|
|
Response time up |
Triage or dispatch is overloaded |
Create priority rules by asset, location, and risk |
|
Completion time up |
Work is stuck after assignment |
Track parts, approval, and vendor wait reasons |
|
Backlog aging |
Planned work is losing to emergencies |
Reserve labor blocks for PM and high-risk backlog |
|
PM compliance down |
Schedule is unrealistic or understaffed |
Adjust routes, asset frequency, or workload |
|
Downtime up |
Assets are failing more often or longer |
Review failure codes and repeat repairs |
|
Vendor on-time rate down |
SLA or scope control is weak |
Standardize scopes and require timestamped updates |
|
Cost per location up |
Site mix or emergency work is changing |
Compare spend by asset class and work type |
What will change for KPI tracking by 2027?
By 2027, maintenance KPI tracking will likely become more automated, location-aware, and exception based. Facility teams will spend less time building reports and more time reviewing the few items that need intervention.
Three shifts are already visible. First, mobile work orders are becoming the record of truth, especially for photos, timestamps, and vendor proof of work. Second, offline capability matters more as facilities teams work in basements, campuses, back rooms, and remote sites with weak signal. The operational cost of that gap is explained in poor connectivity in facilities management. Third, multi-location reporting is moving away from generic averages toward peer comparisons by site type, asset mix, and service model.
Leansite is built for that practical middle ground: field-friendly task tracking, vendor coordination, and portfolio visibility without forcing teams into an overbuilt enterprise system. More information is available at getleansite.com for teams comparing options.
Facility maintenance KPI FAQ
Facility KPI programs work best when definitions are simple, formulas stay consistent, and reviews lead to action. These common questions cover the decisions most teams face when building a reporting habit.
How many maintenance KPIs should a facility team track?
Most facility teams should start with five to seven maintenance KPIs. A smaller set is easier to explain and act on. Response time, completion time, backlog, PM compliance, downtime, vendor performance, and cost per location cover the main operating risks without creating reporting clutter.
What is the difference between MTTR and completion time?
MTTR, or mean time to repair, measures how long repair work takes once the repair process begins. Completion time measures the full work order cycle from request to closeout. Completion time is better for service management, while MTTR is better for asset reliability analysis.
Should vendor KPIs be tracked separately from internal team KPIs?
Vendor KPIs should be tracked separately because vendors operate under different scopes, schedules, and contract terms. On-time arrival, first-time fix, documentation quality, and invoice accuracy help facility leaders manage provider performance without mixing outside delays into internal labor metrics.
Conclusion
The best facility maintenance KPIs turn daily work into better decisions about uptime, staffing, vendors, and spend. Start with the seven core metrics, assign an owner to each one, review trends on a fixed cadence, and change the workflow when the data points to a bottleneck. For teams ready to connect work orders, vendor updates, and location-level reporting, Leansite offers a practical next step. Visit getleansite.com to see how KPI tracking can move from static reports to daily operational control.